- Catalogs
- GESCASER MONITORING SLU
- CTC+ software
- Company
- Products
- Catalogs
- News & Trends
- Exhibitions
CTC+ software
1 /1Page
CTC+ software
1 /1Page
Catalog excerpts
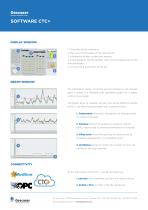
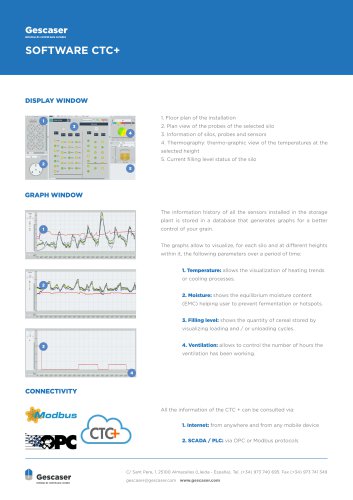
GRAPH WINDOW 1. Floor plan of the installation 2. Plan view of the probes of the selected silo 3. Information of silos, probes and sensors 4. Thermography: thermo-graphic view of the temperatures at the selected height 5. Current filling level status of the silo The information history of all the sensors installed in the storage plant is stored in a database that generates graphs for a better control of your grain. The graphs allow to visualize, for each silo and at different heights within it, the following parameters over a period of time: 1. Temperature: allows the visualization of heating trends or cooling processes. 2. Moisture: shows the equilibrium moisture content (EMC) helping user to prevent fermentation or hotspots. 3. Filling level: shows the quantity of cereal stored by visualizing loading and / or unloading cycles. 4. Ventilation: allows to control the number of hours the ventilation has been working. 1. Internet: from anywhere and from any mobile device 2. SCADA/ PLC: via OPC or Modbus protocols C/ Sant Pere, 1. 25100 Almacelles (Lleida - Espafia). Tel. (+34) 973 740 695. Fax (+34) 973 741 349 [email protected] www.gescaser.com
Open the catalog to page 1All GESCASER MONITORING SLU catalogs and technical brochures
 Gescaser
5 Pages
- Agricultural software
- Temperature monitoring system
- Data management software
- Real-time monitoring system
- Depth sensor
- Real-time software
- Animal husbandry software
- Building monitoring system
- Crop monitoring system
- Wireless monitoring system
- Silo monitoring system
- Cloud software
- Grain monitoring system
- Planning software
- Moisture monitoring system
- Feed software
- Data acquisition software
- Control software
- Windows software
- Data display systems software