
Catalog excerpts

The Pinova Meteo Station is the most sophisticated agricultural weather station available for agricultural use in the world today. The station comes with a PinovaSoft application that is easy to install, simple to operate and requires only one click to see the average values of measured parameters in the desired time period (10 minutes, 1 hour, 6 hours, day, week, month, year). There are various prognostic models built in to the software that graphicly present to you the possibility of desease incubation or occurance based on the parameters gathered by the station from it’s surroundings. Pinova Meteo Station is intended for all intensive agricultural producers (fruit growers, vegetable growers, wine-growers, farmers) and those who want to be in step with latest technological advances in agriculture. www.pinova-meteo.com pinova@pinova.hr
Open the catalog to page 1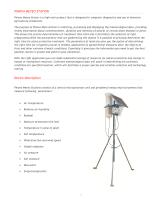
PINOVA METEO STATION Pinova Meteo Staton is a high-tech product that is designed for computer diagnostics and use in intensive agricultural production. The purpose of Pinova Meto station is collecting, processing and displaying the meteorological data, providing timely information about commencement, duration and intensity of attacks of certain plant diseases or pests. This allows the precise determination of treatment time limit and it facilitates the selection of right preparations.With the parameterst that are gathered by the station it is possible to precisely determine the right time...
Open the catalog to page 2
2. LEAF WETNESS SENSOR 4. TEMPERATURE AND RELATIVE HUMIDITY SENSOR 5. SOIL TEMPERATURE SENSOR 6. SOIL MOISTURE SENSOR 7. GLOBAL RADIATION SENSOR 8. LEAF TEMPERATURE SENSOR 9. WIND SPEED AND WIND DIRECTION SENSOR 12. PINOVASOFT APLICATION FOR DATA PROCESSING ON YOUR COMPUTER 13. SOLAR CELL (USED FOR POWERING THE CENTRAL PROCESSING UNIT AND SENSORS) Operation method The measured program parameters are processed on a personal computer where they can be loaded. The data is then transferred through the server to PC using GSM/GPRS modem. The user of Pinova Meteo Station will have aplication on...
Open the catalog to page 3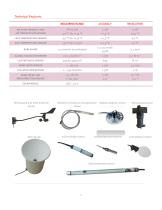
Technical Features MEASURING RANGE RELATIVE HUMIDITY AND AIR TEMPERATURE SENSOR LEAF TEMPERATURE SENSOR SOIL TEMPERATURE SENSOR RAIN GAUGE GLOBAL RADIATION SENSOR LEAF WETNESS SENSOR WIND SPEED SENSOR SOIL MOISTURE SENSOR WIND SPEED AND WIND DIRECTION SENSOR SOLAR MODUL Wind speed and wind direction sensor Rain gauge Relative humidiy and temperature sensor Soil humidity sensor Global radiation sensor Leaf temperature sensor Soil temperaure sensor
Open the catalog to page 4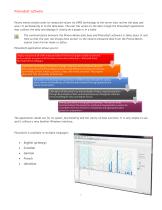
PinovaSoft software Pinova meteo station sents its measured values via GPRS technology to the server that recives the data and save s it permanently in to the data base. The user has access to the data trough the PinovaSoft application that collects the data and displays it clearly on a graph or in a table The communication between the Pinova Meteo data base and PinovaSoft software is takes place in real time so that the user can always have accestr to the newest measured data from the Pinova Meteo station from his/her home or office. PinovaSoft application allows you to: Display and print...
Open the catalog to page 5
Simple choice of parameters Overall associated software modules, allow you to manage the station and the data that are required for agronomists. Simple selection of parameters in a desired time period that interest you. o Within the display option in the application the user can limit the time frame under the date that he wishes to observe. To read out the measured values more easily it is also allowed to choose from the data that you wish to see in the graphical or tabular display.
Open the catalog to page 6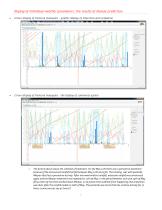
Display of individual weather parameters, the results of disease prediction. 6 hour display of Venturia Inaequalis – graphic display of infections and incubation 2 hour display of Venturia Inaequalis – the display of comments option The picture above shows the schedule of treatment. On the May 11th there was a preventive treatment because of the announced rainfall that fell between May 12th and 13th. The treating was with pesticide Merpan that has a preventive activity. After one week without rainfall, extensive rainfall was announced again and the Merpan treatment was repeated in 21th of...
Open the catalog to page 7
Only basic climatic data in a daily data display 2 hour display- graphic display of all the data from the station in Vratisinec
Open the catalog to page 8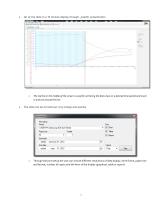
All of the data in a 10 minute display through- graphic presentation The red line in the middle of the screen is used for centering the data view on a desired time period and zoom in and out around the line. The data can be printed out very simply and quickly Through the print setup the user can choose different resolutions of data display, dime frame, paper size and format, number of copies and the form of the display (graphical, table or report).
Open the catalog to page 9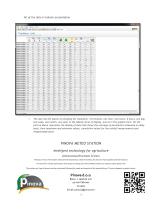
All of the data in tabular presentation The user has the option of changing the resolution (10 minutes, one hour, two hours, 6 hours, one day, one week, one month, one year) in the tabular form of display, just as in the graphic form. On the picture above represents the display of data that shows the averages of parameters measured on daily basis, their maximum and minimum values, cumulative values for the rainfall measurements and evapotranspiration. PINOVA METEO STATION Inteligent technology for agriculture Central processing unit has 8 inputs for sensors. The basic version of the station...
Open the catalog to page 10